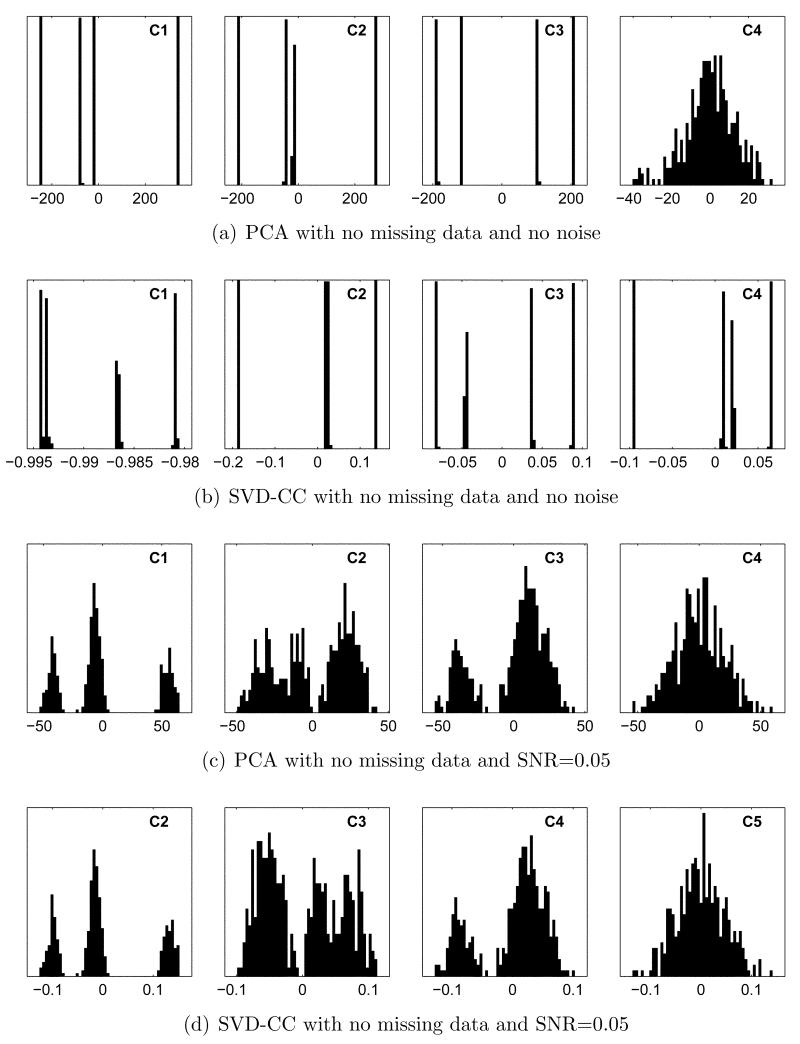
Figure 4.
Coefficient histograms with no missing data. (a),(b): SNR=∞. (c), (d): SNR=0.05. In (a) and (b), discrete peaks correspond to individual classes. In (c) and (d), the 3 peaks in the left panel correspond to classes 1, 3+4 (combined), and 2. Subsequent coefficients provide further resolution.

