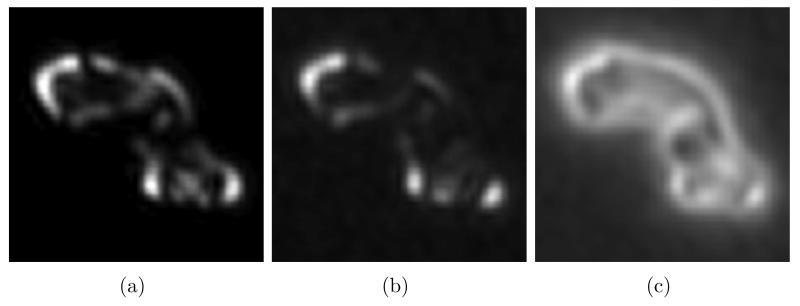
Figure 9.
Central 5.4 nm xy slices of standard deviation maps. (a): true standard deviation between classes 1 and 2, computed as the square root of 0.175 times the squared difference between the volumes. (b,c): WMD-corrected and conventional (uncorrected) estimates, respectively, of standard deviation with 30% missing data and SNR=0.2.

