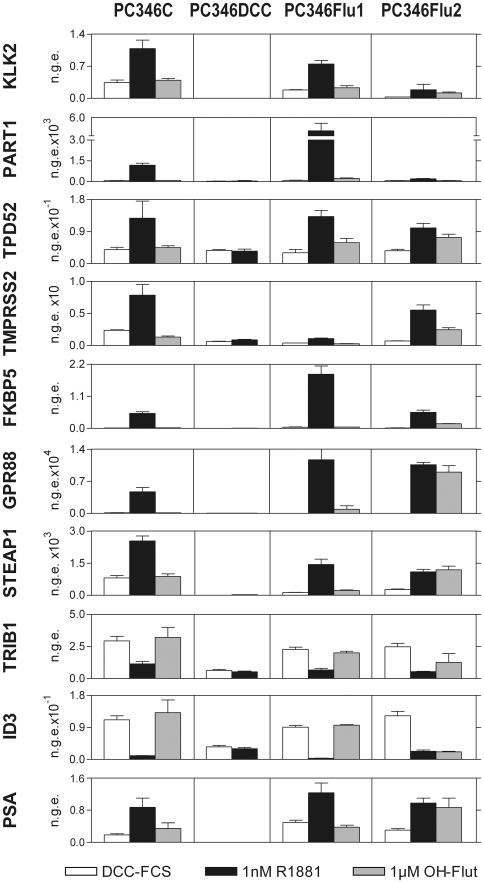
Figure 1. Validation of the microarray results.
Quantitative RT-PCR analysis of a set of 10 androgen-regulated genes in PC346 cell lines. Cells were stimulated with 1 nM R1881 (R1881), 1 mM OH-flutamide (Flut) or vehicle control (DCC-FCS) for 16h. The graphs show the Mean (± SE) of the normalized gene expression (n.g.e.) relative to the housekeeping gene GAPDH, for two independent cell passages. ID3 and TRIB1 were androgen-repressed in the microarray assays, whereas the other genes were up-regulated by androgens.

