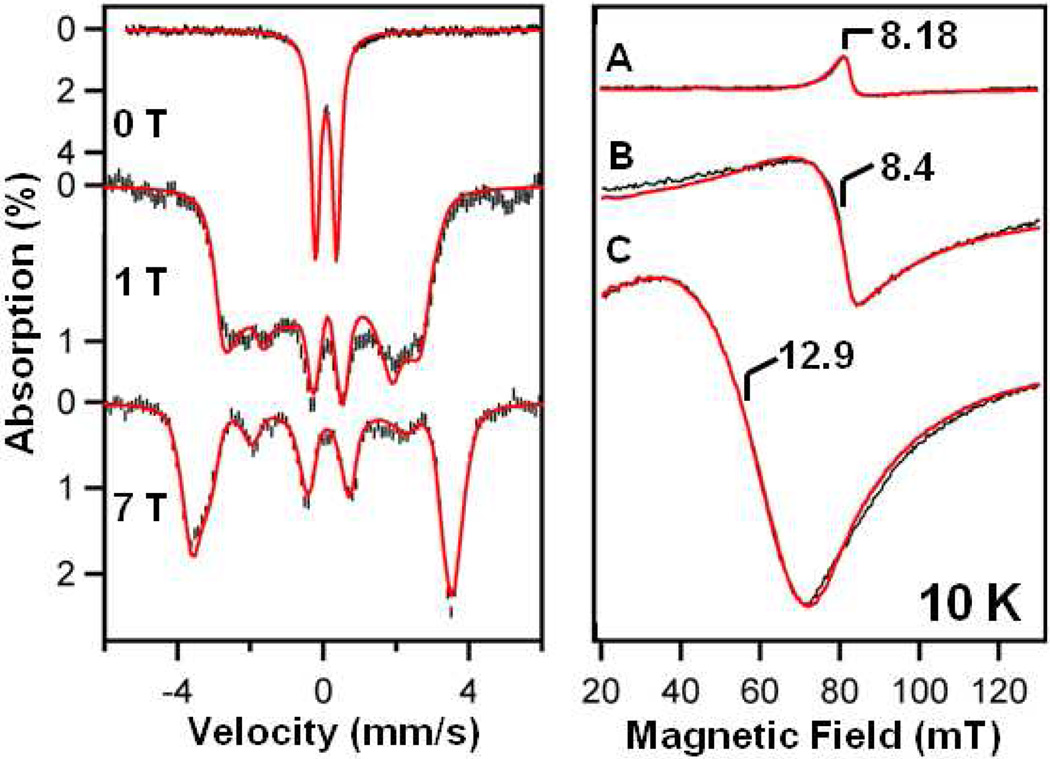
Figure 3.
Left panel: Selected 4.2 K Mössbauer spectra of 7 in CH3CN (black) recorded in parallel applied magnetic fields, as indicated. For all spectra, a high-spin FeIII impurity, representing ~ 12% of the iron, has been subtracted from the raw data. Solid red lines are spectral simulations using the parameters in Table 1. Additional spectra are shown in Figures S4 – S7. Right panel: X-band EPR spectra (black) of (A) 7-N3, (B) 7, and (C) 7-Cl. Red lines are spectral simulations for (A) D = 5.0 cm−1, E/D = 0.05, σE/D = 0.02; (B) D = 4.2 cm−1, E/D = 0.1, σE/D = 0.03; (C) D = 4.2 cm−1, E/D = 0.14, σE/D = 0.016. In all simulations, intrinsic g values were kept isotopic (gx = gy = gz = 2). σE/D is the width of an assumed Gaussian distribution of E/D. Additional spectra are shown in Figures S8 – S10. Experimental conditions: B1‖ B; temperature, 10 K; microwave power, 2 mW (for B and C) and 20 mW (for A) at 9.28 GHz.

