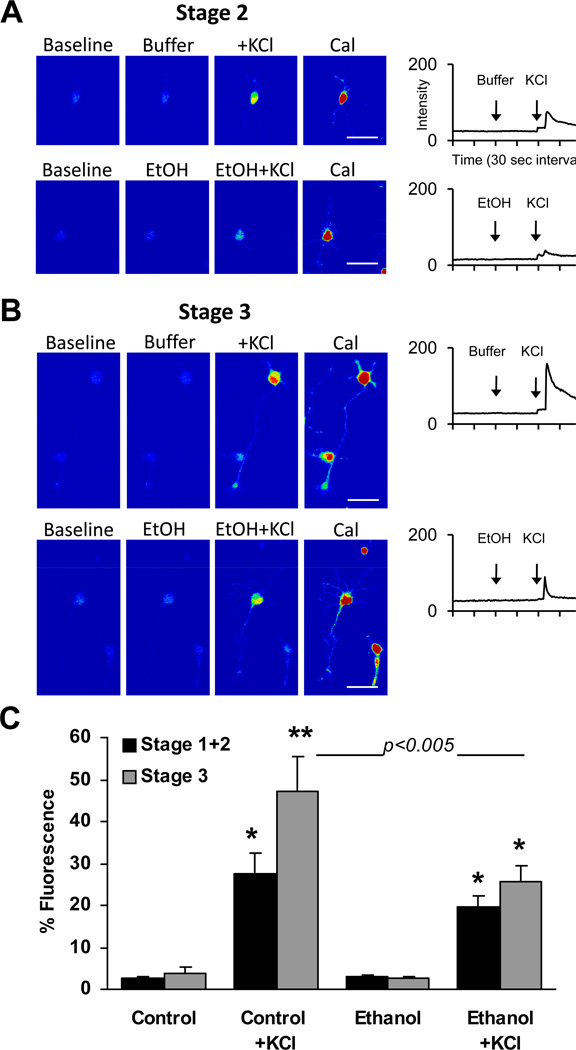
Figure 1. Effect of axon specification on intracellular calcium response to 7 mM KCl after acute exposure to 87 mM ethanol (EtOH) or buffer without ethanol.
Hippocampal neurons were imaged 18–30 h after plating. Representative pseudocolor images of a Stage 2 (A) and Stage 3 (B) neuron and a corresponding plot of Fluo-4 fluorescence intensity (in arbitrary units) over time after addition of reagents (arrows). Images of peak fluorescence after addition of 1 ug/mL Calcimycin (Cal) under each condition are shown to better visualize cell morphology, but intensities are not plotted. For all treatment conditions, maximum and minimum fluorescence intensity was 233–245 and 1–10, after the addition of Cal and EGTA, respectively. C. Histogram plot of percent fluorescence values (calculated as described in Methods) in an 18×25 pixel region of interest (ROI) over the soma expressed as the means ± SEM. Data are the combined results of 3 separate cultures from which a total of 65 Stage 1 or Stage 2 neurons and 30 Stage 3 neurons were sampled from a total of 10 separate coverslips. *p < 0.01 and **p < 0.001 compared to pre-stimulated values (repeated measures ANOVA with Dunnett post hoc test); bar with p < 0.005 compared Control + KCl response with Ethanol + KCl response (ANOVA with Newman-Keuls post hoc test). Scale bar = 50 µm

