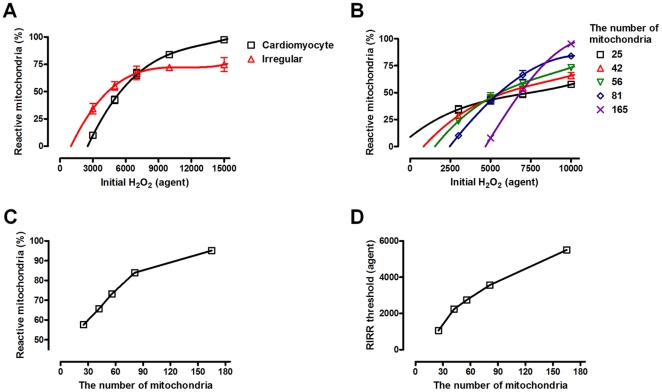
Figure 3. Dose dependence on the oxidative stress.
(A) At a time point 3000 (the number of simulation steps), the cardiomyocyte model shows a steeper gradient than the irregular distribution of mitochondria model. (B) Dose-dependence on the initial oxidative stress is also tested for different cytosolic densities of mitochondria (regular distribution). The higher cytosolic number of mitochondria model is more sensitive to initial oxidative stress. The third order polynomial equations are used for curve fitting in (A) and (B) (C) When initial H2O2 is sufficiently high (10000), the fraction of reactive mitochondria increases according to the number of mitochondria, indicating a significant dose-dependency. (D) RIRR threshold is defined by the initial H2O2 of the regression estimate for reactive mitochondria = 20%.

