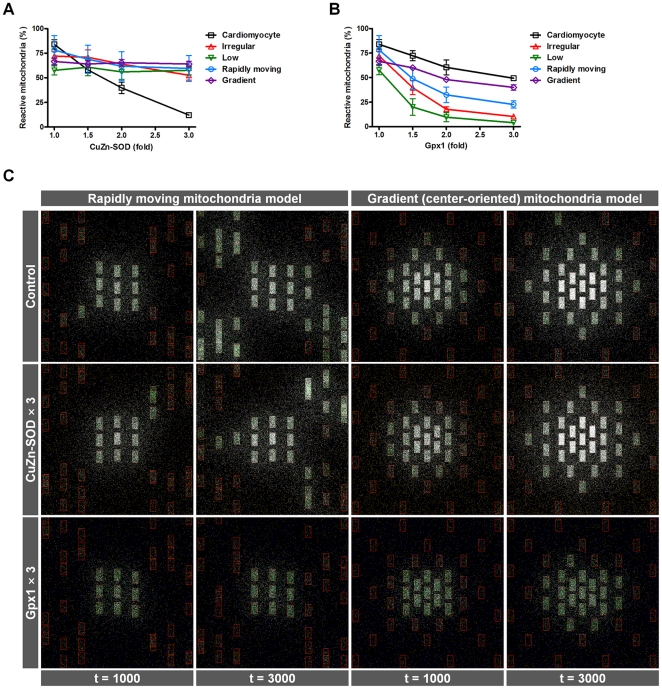
Figure 5. Change of ROS propagation and messenger molecules by mitochondrial distribution and cytosolic density of mitochondria.
(A–B) Fractions of reactive mitochondria according to the amount of CuZn-SOD (A) and cytosolic Gpx (B) are shown at a specific time point (the number of simulation steps = 3000). The x-axis indicates the amount of each cytosolic antioxidant, and the y-axis indicates the fractions of reactive mitochondria involved in RIRR and mitochondria-driven ROS propagation. (C) Captured images of real simulation steps in the rapidly moving and gradient mitochondria models with control (top panel), increase in CuZn-SOD (middle panel), or cytosolic Gpx (bottom panel). In the rapidly moving mitochondria model, peripheral mitochondria were defined to move vertically at each simulation step.

