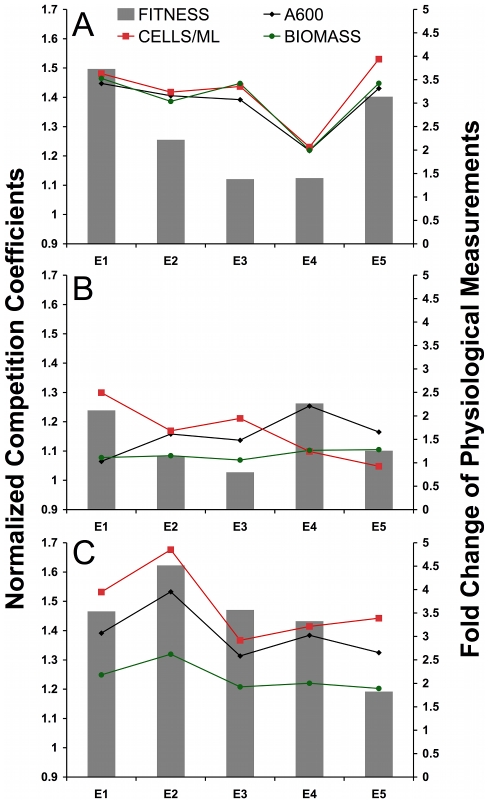
Figure 2. Physiological Fold-Changes Overlaid on Fitness.
Representation of physiological data combined with fitness data for three environments A) aerobic glucose limitation, B) anaerobic glucose limitation, C) aerobic acetate limitation. Primary (left) y-axis is normalized competition coefficient (same normalization as Figure 1). Secondary (right) y-axis is fold change (evolved/ancestral) of steady state physiological data including A600 (optical density at 600 nm), cells mL−1, and biomass g 100 ml−1. See Table S3 for un-normalized values and statistical analysis.

