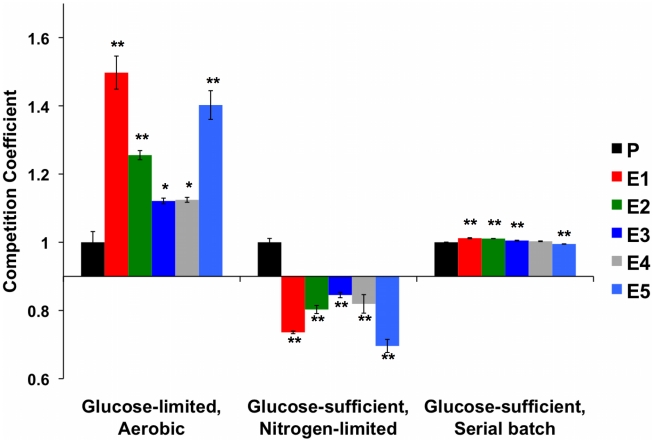
Figure 6. Normalized Competition Coefficients for 2 Glucose-Rich Environments.
Data are competition coefficients calculated by competing each strain (evolved and ancestor CP1AB) against a common reference strain. Values are the average of three biological replicates, with values normalized such that ancestral CP1AB (“P”) equals 1 in each environment. Significant differences versus CP1AB within each environment were calculated using a 2-tailed t-test. “*” indicates p<0.05 and “**” p<0.01. Error bars represent the Standard Error of the Mean. See Table S8 for un-normalized, average competition coefficients. Aerobic Glucose-limited data are the same as in Figure 1 and were added for comparison.

