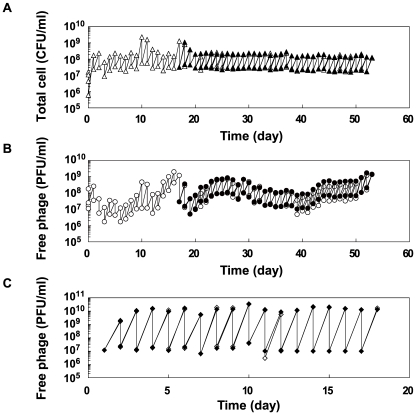
Figure 2. Population dynamics in the copropagation or Qβ propagation experiments.
(A) Population dynamics of E. coli density (CFU/ml) in the copropagation experiments. Mixed cultures were divided into 2 lines on the 18th day, equivalent to 59 replication generations, and propagated independently for a further 36 days (line 1 and line 2). On the 10th and 17th days, we restarted the copropagation experiment from stock cultures stored at −80°C. The open and closed triangles indicate the cell density of line 1 and line 2, respectively. (B) Population dynamics of free Qβ density (PFU/ml) in copropagation experiments. Open and filled circles indicate the free phage density of line 1 and line 2, respectively. (C) Population dynamics of free Qβ density (PFU/ml) in the Qβ propagation experiment. The open and filled diamonds indicate the free phage density of line 3 and line 4, respectively.

