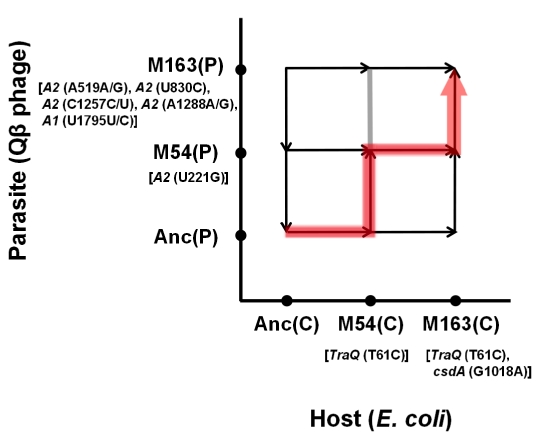
Figure 8. Estimation of evolutionary path.
The direction of the arrowhead on each arrow indicates higher fitness. The gray line at M54(C) indicates that M54(P) and M163(P) showed almost equivalent fitness on M54(C). The red line indicates the plausible route for fixing M163(C) and M163(P) in this study. The genes in which mutations compared with the ancestor and detected only in the copropagation regime are shown in brackets, and the mutation positions in each gene for E. coli and in the Qβ genome are shown in parentheses.

