
Figure 1. CRY2 Undergoes Blue Light-Dependent Interaction with SPA1.
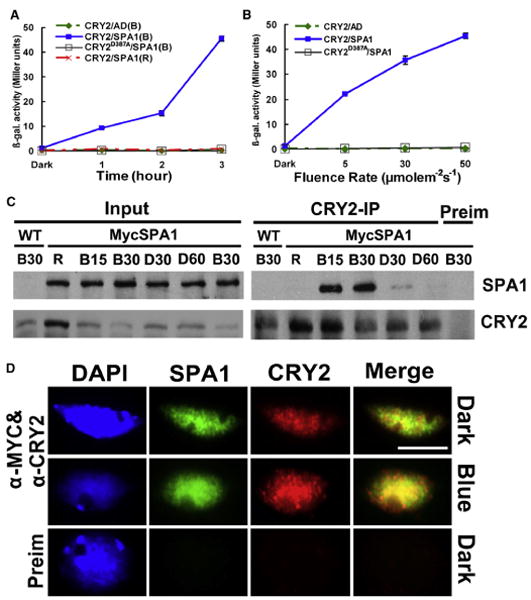
(A and B) Yeast two-hybrid experiments showing the wavelength- and fluence rate-dependent CRY2-SPA1 interaction. Yeast cells expressing the indicated proteins were irradiated with red light (R, 50 μmolem−2s−1) or blue light (B, 50 μmolem−2s−1) for the time indicated (A), or irradiated with blue light of the fluence rates indicated for 3 hr (B). β-galactosidase activities were assayed and the standard deviations (n = 3) are shown.
(C) Co-IP experiments showing the blue light-dependent CRY2-SPA1 complex formation in plant cells. Fourteen-day-old wild-type (WT) and transgenic plants expressing Myc-SPA1 were transferred to red light (R, 20 μmolem−2s−1) for 18 hr, then exposed to blue light (20 μmolem−2s−1) for 15 min (B15) or 30 min (B30). After blue light treatment, aliquots of plant samples were transferred to darkness for 30 min (D30) or 60 min (D60). Immunoblots of the total protein extracts (Input) and immunoprecipitation (IP) product of the CRY2 antibody or preimmune serum (Preim) were probed by the Myc antibody, stripped, and reprobed by the CRY2 antibody.
(D) A coimmunostaining experiment showing the blue light-induced colocalization (indicated by yellow spots) of CRY2 (red) or Myc-SPA1 (green). The images of the same cell from separate color channels were merged by the merge program of Photoshop and shown (Merge). The scale bar indicates 5 μm.
Also see Figure S1.