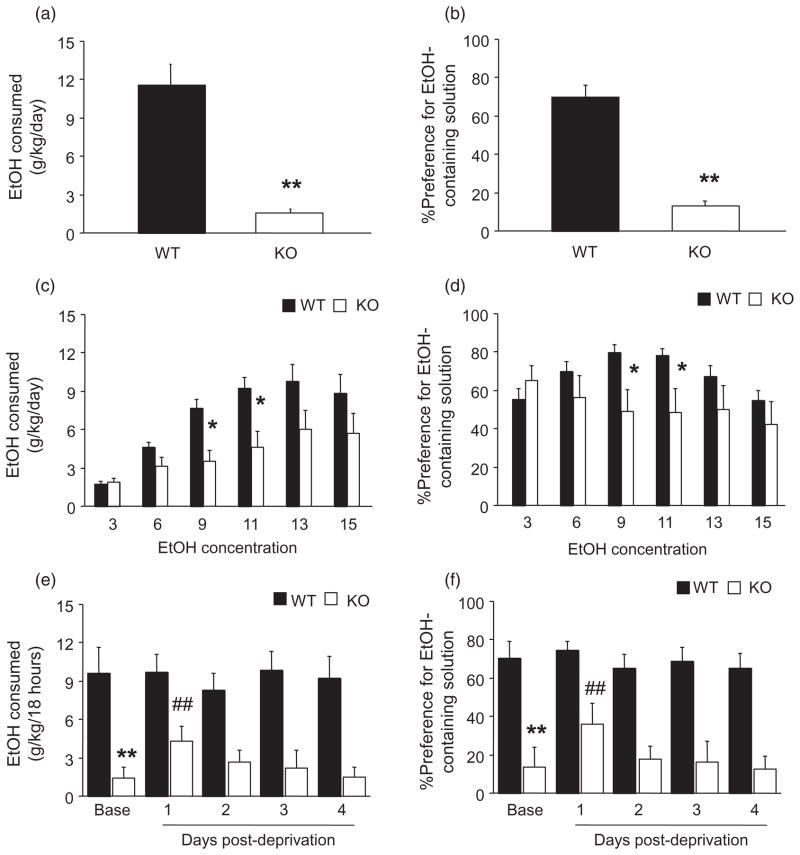
Figure 2.
PSD-95 KO show reduced EtOH drinking. (a) When offered a single (15%) concentration of EtOH, KO consumed significantly less EtOH and (b) had a significantly lesser preference for EtOH than WT (n = 8–9/genotype). (c) When offered increasing concentrations of EtOH, KO consumed significantly less EtOH at 9% and 11% concentrations and (d) had significantly lesser preference at 9% and 11% concentrations relative to WT (n = 12/genotype). (e) Prior to EtOH deprivation, KO consumed significantly less (15%) EtOH than WT. KO, but not WT, consumed significantly more EtOH 1 day after deprivation, relative to pre-deprivation baseline, and this elevation returned to baseline over the next 3 days. (f) KO showed significantly lesser preference for EtOH than WT during pre-deprivation baseline, and KO, but not WT, showed a significant increase in preference 1 day (but not 2–4 days) post-deprivation, relative to pre-deprivation baseline (n = 8/genotype). Data are Means ± SEM. **P < 0.01, *P < 0.05 versus WT/same concentration or period, ##P < 0.01 versus KO baseline

