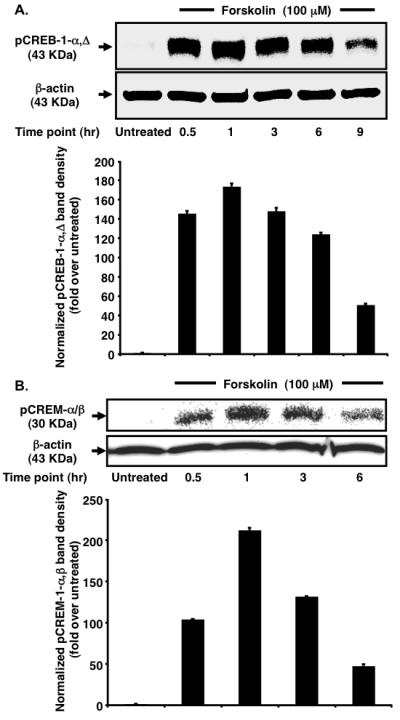
Fig. 2.

Forskolin stimulation leads to increased nuclear accumulation of pCREB-1α,Δ and pCREM-α/β in TF-1 cells. (A) Analysis of the kinetics of CREB-1 phosphorylation reveals negligible pCREB-1 in the untreated sample. Following forskolin stimulation, maximum pCREB-1 is found at 1 h. Heightened pCREB-1 levels persist up to 6 h followed by dephosphorylation at 9 h. β-actin serves as a normalization control. (B) Analysis of the kinetics of pCREM accumulation reveals a bell-shaped curve. Following stimulation, an exponential increase occurs in nuclear pCREM levels. Maximal accumulation is observed at 1 h. Thereafter, levels drop rapidly up to 6 h. β-actin serves as a loading control.
