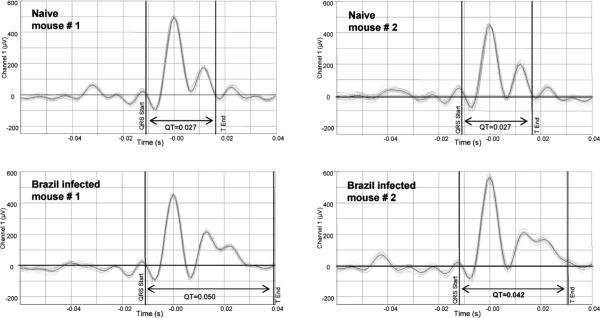
FIGURE 2.
QT interval analysis of Trypanosoma cruzi infected mice. ECG recordings were obtained from individual naïve and T. cruzi infected BALB/c mice (3 wk PI with 5,000 Brazil strain TCT i.p.). An automated software package was used to plot and average 20 consecutive beats, and cursers placed to denote points used to analyze the QT interval. Shown are example tracings and QT intervals obtained from 2 random naïve (0.027s and 0.027s) and T. cruzi infected BALB/c mice (0.050s and 0.042s).

