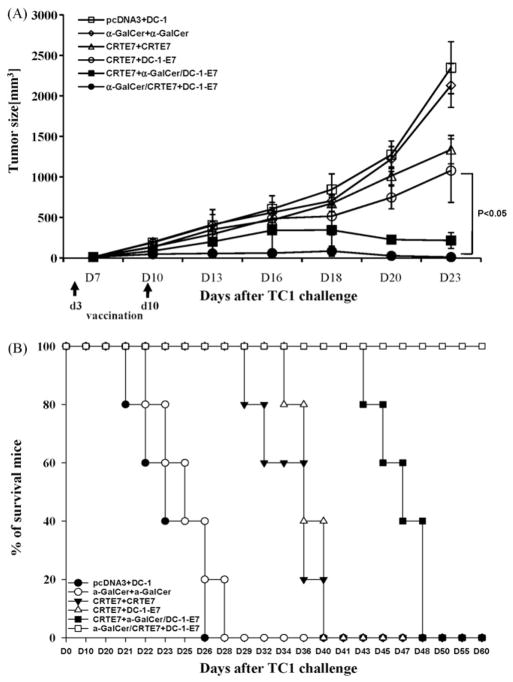
Fig. 4.
In vivo tumor treatment experiments. C57BL/6 mice (n = 5 per group) were initially challenged with a s.c. injection of TC-1 tumor cells (2 × 10⁵/mouse). Mice received DNA injections (100 μg of DNA/mouse) three days after tumor challenge with or without added α-GalCer (2 μg/injection). The mice were boosted 1 week later with various vaccine combination regimens, including DNA vaccine or E7-pulsed DC-1 in the presence or absence of α-GalCer. The mice vaccinated with pcDNA3 or α-GalCer was used as controls. The mice were monitored for evidence of tumor growth by twice weekly inspection and palpation. Tumor volumes were measured starting at day 7 after tumor challenge. (A) Line graph depicting tumor volumes in mice of different tumor treatments (mean ± SD values). (B) Kaplan–Meier survival analysis in mice from the tumor treatment experiments. The data shown here are from one of two representative experiments.

