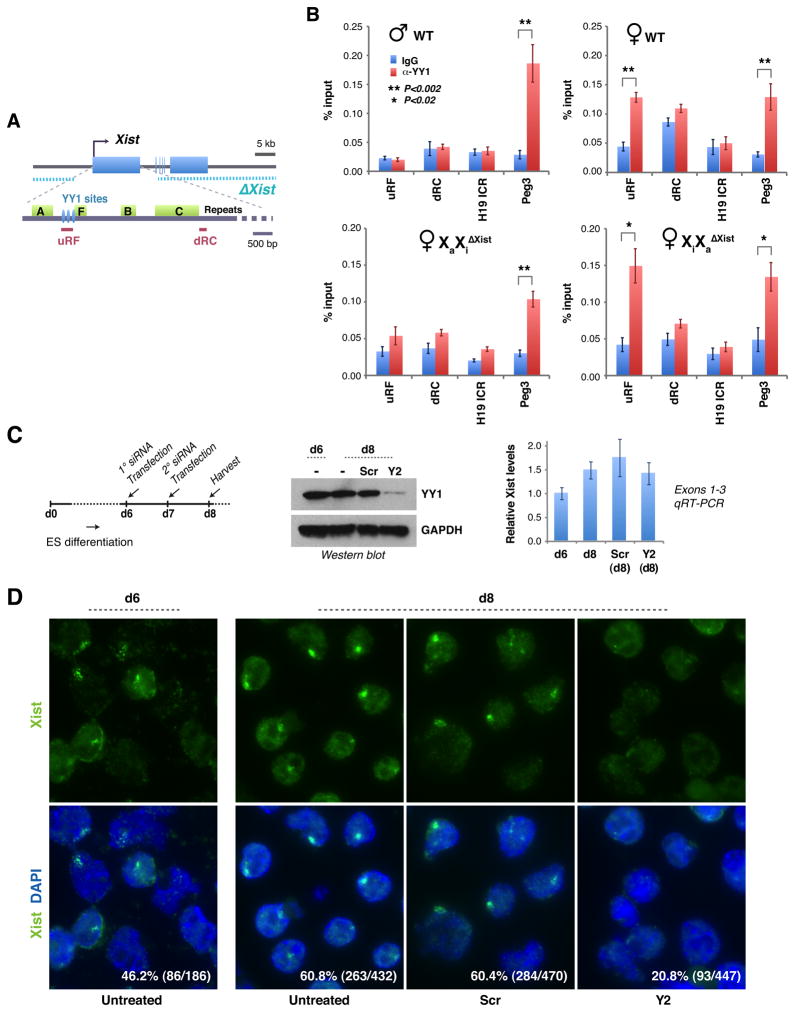
Figure 5. YY1 binds specifically to Xi.
A. Map of the Xist deletion (Csankovszki et al., 1999; Zhang et al., 2007), ChIP amplicons, and YY1 sites.
B. YY1 ChIP analyses. At least three independent experiments performed for each cell line. Averages ± standard errors (SE) from ≥3 independent experiments shown. Statistical significance, P, determined by the Student t-test (asterisks).
C. YY1 knockdown in differentiating female ES cells (TsixTST/+) via the indicated timeline. Cells were split into siRNA-treated and –untreated samples on day 6 (d6). Western blot showed good knockdown. Xist qRT-PCR showed constant steady state levels; averages ± SD from three independent knockdown experiments shown.
D. Xist RNA FISH after YY1 knockdown in female ES cells. Percentage of Xist+ cells and sample sizes shown.

