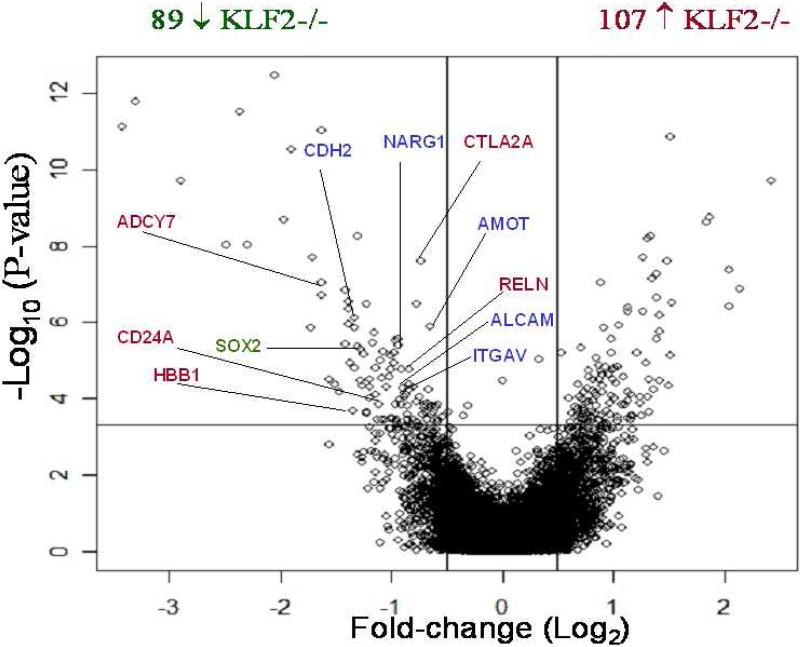
Figure 2.
Volcano plot showing differentially expressed genes between KLF2-/- and WT E9.5 erythroid cells using both biological and statistical dimensions. The x-axis is the fold change on a log scale. The y-axis represents the negative log10-transformed p-values of differences between the samples calculated using the S-score method. Above the horizontal line, there is a p-value <0.0004 and a q-value<0.05. Genes located between the two vertical lines had no change in expression. The genes in red are erythroid-enriched genes and those in blue are essential for cardiovascular development. The single gene in green (SOX2) is important for stem cell renewal.

