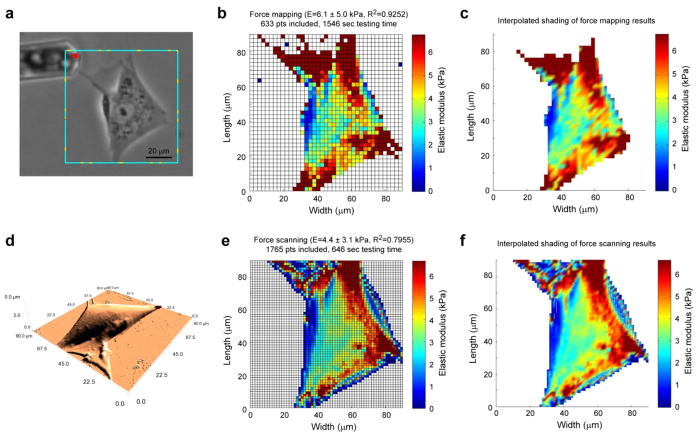
Figure 3.
Spatial modulus mapping of spread cells. A representative ASC (a) was imaged using contact-mode AFM (d) and then mechanically tested using a 40×40 pt force map (b, c) and a 64×64 pt force scan (e, f). Images from the more rapid, higher-resolution force scanning technique could depict the underlying cytoskeletal structure in greater detail in a shorter time. The force mapping images shown above took 2.4 times longer to capture than the force scanning images (25.8 vs. 10.8 minutes).

