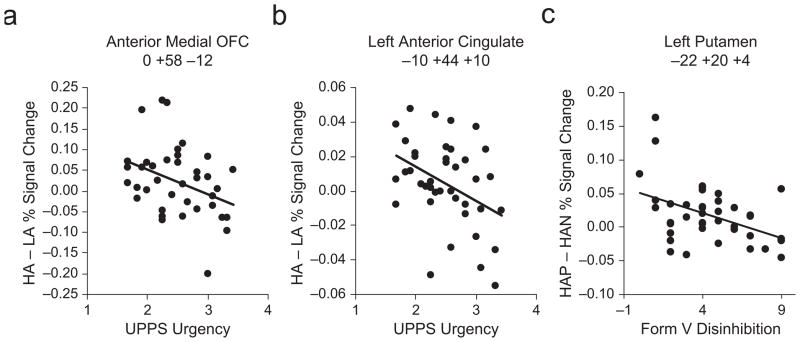
Fig. 2.
Scatter plots illustrating the association between brain activation and personality traits. For the anterior medial orbitofrontal cortex (OFC; a) and left anterior cingulate (b) regions activated more strongly for high-arousal than for low-arousal stimuli in low sensation seekers, functional magnetic resonance (fMRI) signal change for high-arousal (HA) versus low-arousal (LA) pictures is plotted as a function of urgency (score on the UPPS Impulsivity Scale; Whiteside & Lynam, 2001). For the left putamen region activated more strongly for positive than for negative high-arousal stimuli in low sensation seekers (c), fMRI signal change for positive high-arousal pictures (HAP) versus negative high-arousal pictures (HAN) is plotted as a function of disinhibition (measured by Form V of the Zuckerman Sensation-Seeking Scale; Zuckerman, 1994). Results for both high and low sensation seekers are plotted in all three graphs. The Montreal Neurological Institute coordinates for each region are shown at the top of the figure. See Table 2 for details on the corresponding regression coefficients.

