Figure 1.
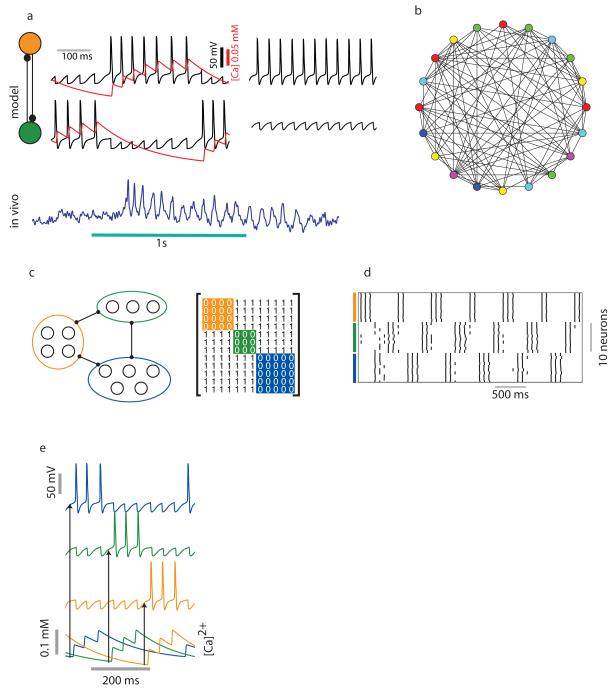
Clustering in inhibitory networks as a function of graph coloring. a) A reciprocally connected pair of inhibitory neurons is an example of a graph with chromatic number two. Left traces: An alternating pattern of bursts is generated in response to a constant external stimulus to both neurons. A Ca2+ dependent K current (shown in red) causes spike frequency adaptation. Right traces: In the absence of a Ca2+ dependent K current only one neuron produces spikes and the other is quiescent. Blue trace at the bottom: spike frequency adaptation in a local inhibitory interneuron recorded in vivo from locust antennal lobe.
b) A coloring generated for a random network of 20 neurons with connection probability 0.5. c) A graph with chromatic number 3 and its corresponding adjacency matrix. d) Raster plot showing the activity of a network of 30 neurons with chromatic number three. Ten neurons are associated with each color. e) The role of Ca2+ concentration on the timing of LN bursts. The bottom traces show the Ca2+ concentration in three LNs (top three traces) associated with three different colors. The neuron with the lowest concentration of Ca2+ tends to spike first.

