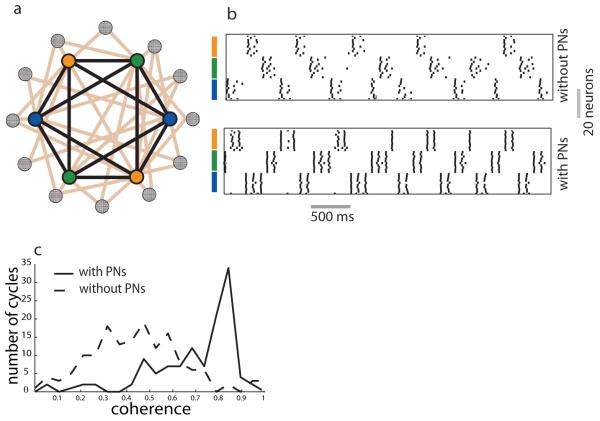
Figure 4.
Excitation preserves coloring–based dynamics.a) Schematic of the antennal lobe network. Nodes with solid colors: groups of inhibitory interneurons associated with a particular color. Projection neurons (shown as checkered circles) are randomly connected to and receive connections from the inhibitory sub– network. b) Raster plot showing the dynamics of the inhibitory sub–network when excitatory neurons were present (bottom panel) or absent (top panel). c) The distribution of a measure of spike coherence over cycles of the local field potential oscillation, the mean coherence of spikes within a cycle increased when excitatory connections were added. The coherence (R) of spikes within each cycle of the oscillatory local field potential Rj =(∑Cosθi )2 +(∑Sinθi )2 was calculated for each cycle j. The distribution was generated from all values of Rj. Excitation enhanced coloring–based dynamics of the inhibitory network.

