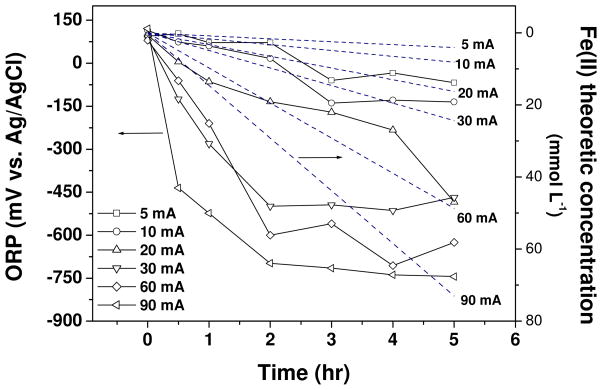
Figure 3.
Time profiles of electrolyte ORP at different electrolysis currents (39 mg L−1 initial TCE concentration). The Fe(II) theoretic concentrations (dash line) were calculated based on Faraday’s law using 100% current efficiencies (this is hypothetical and actual efficiencies are less than 100%). Copper foam cathode and cast iron anode. The arrows in the figure refer to the relevant Y-axis.

