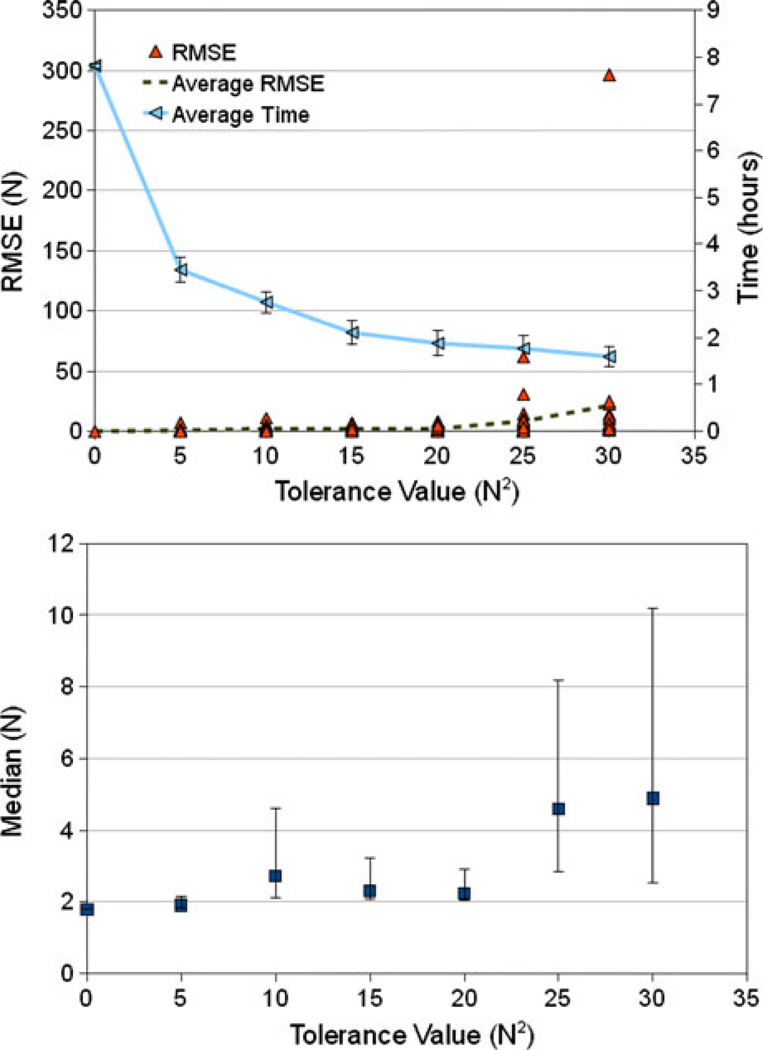
FIGURE 3.
Root mean square errors (RMSE) and computational cost. (Top) Using simulated annealing (SA), model vs. experimental RMSE (see Eq. (5)) were calculated for each of the 20 results at every tolerance value. Average RMSE values as a function of tolerance were included and show consistent results up to a tolerance value of 25 N2. Average computation time with corresponding standard deviations was also plotted and demonstrates a decrease in expense with increasing tolerance. (Bottom) Quartile breakdowns for the SA RMSE results as a function of tolerance value. Values for the 25th percentile, median (squares), and 75th percentile were included, and results demonstrated increasing values above a tolerance of 20 N2. For clarity, the quartile breakdowns were calculated using the raw data (triangles) in the top plot.

