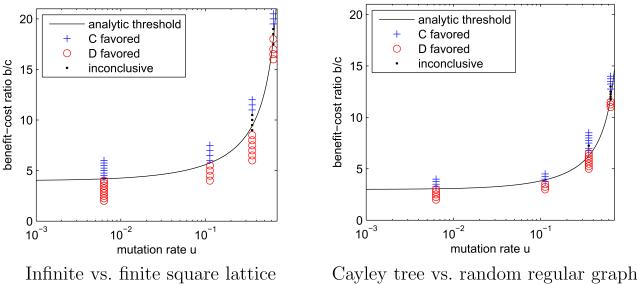
Figure 4.
Theoretical cooperation thresholds, and simulation results on related graphs, as a function of mutation rate. Left: Comparison of analytical results for an infinite square lattice with simulation results on a 20 × 20 lattice with periodic boundary. Right: Comparison of analytical results on the k = 3 Cayley tree with simulation results for a random regular graph of degree 3 with 400 nodes. Random regular graphs locally approximate Cayley trees (Szabó & Fáth, 2007); however, some deviations between analytical and simulation are expected due to the possible presence of short loops in random regular graphs. A + (○) indicates that cooperators are favored (disfavored) with 98% confidence after 1000 simulation runs. A dot (·) indicates that neither statement could be made with 98% confidence. In each case the cost c is 1 and the selection strength δ is 0.01. Simulation procedures are described in Appendix D.

