
Figure 6.
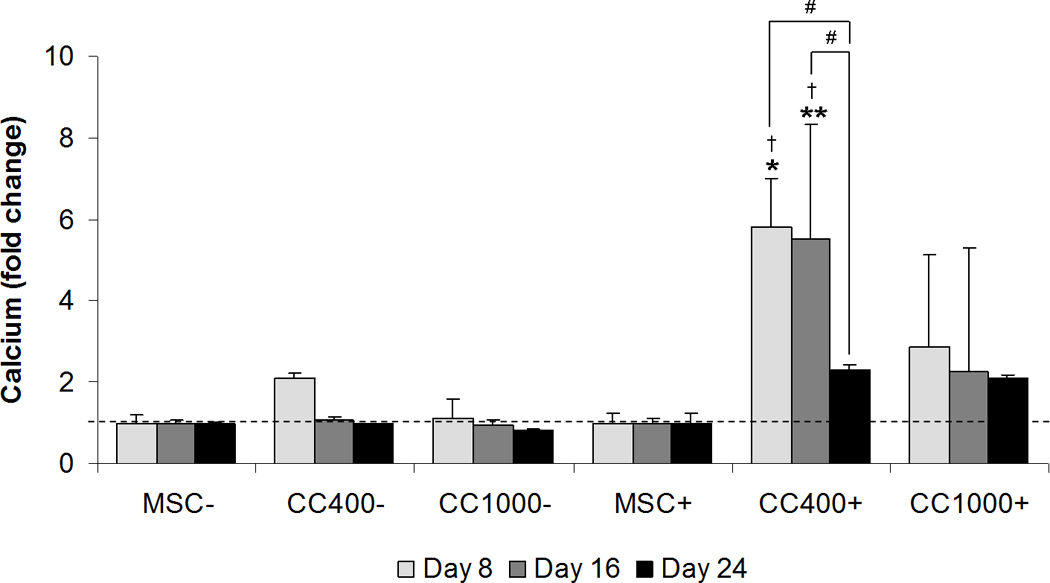
Calcium content of wells cultured with MSCs alone (MSC) or MSCs and HSPCs in co-culture (CC) at specified seeding densities (400 or 1000 HSPCs seeded onto 40,000 MSCs) either with (+) or without (−) the addition of dexamethasone. Plots show fold change in calcium content as compared to cultures with MSCs for each dexamethasone treatment at each time point. Data are presented as mean ± standard deviation for n = 4. Within a specific treatment group, significant difference (p < 0.05) between time points is noted with (#). Within each culture group at a specific time point, significant difference (p < 0.05) between dexamethasone treatment is noted with (†). Within each dexamethasone group at a specific time point, significant difference (p < 0.05) compared to MSCs alone is noted with (*), with significant difference (p < 0.05) compared to all other groups noted with (**).