
Figure 2. Assessment of aortic valve function in mice.
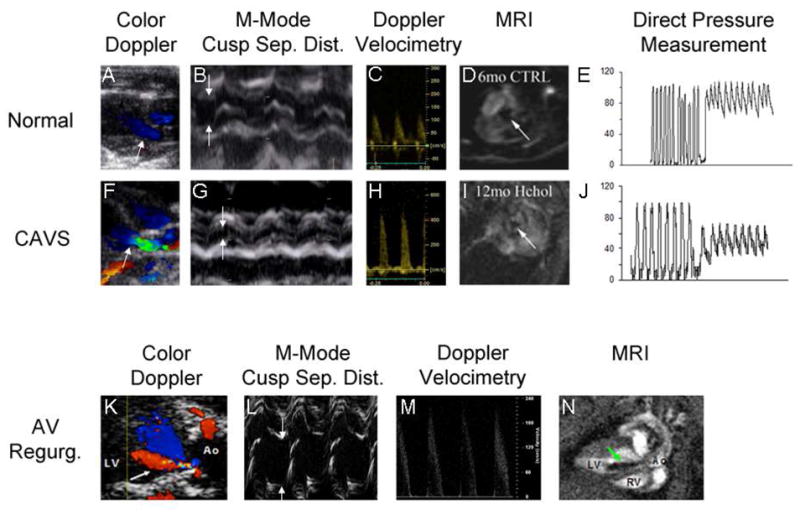
Two-dimensional color Doppler images (Panels A,F,K) are used to target M-mode imaging of the aortic valve and Doppler velocimetry, and to assess the presence (arrow, panel K) or absence of aortic regurgitation. Direction of blood flow is indicated by pseudocolors (red = blood flow towards probe, blue = blood flow away from probe). In CAVS, the irregular stenotic valve orifice causes flow acceleration and turbulence (green). The superior spatial and temporal resolution of M-mode echocardiography facilitates quantitation of systolic cusp separation (arrows, panels B,G,L). Doppler velocimetry (Panels C, H, M) allows for estimation of the transvalvular systolic pressure gradient via the Bernoulli Equation. Aortic regurgitation can cause a modest transvalvular systolic pressure gradient even in the absence of reductions in cusp separation (Panel L, green arrow points to regurgitant jet), by virtue of pre-load dependent increases in contractile force and stroke volume and subsequent increases in velocity (Panel M). Magnetic resonance imaging provides temporal and spatial resolution sufficient to portray the aortic valve orifice in two dimensions (arrows, Panels D,I), by virtue of magnetic dephasing of ejected blood. The same principle is employed to depict retrograde flow when aortic regurgitation is present (arrow, Panel N, cine images can be viewed in the Supplemental Movie). Direct pressure measurements can provide incontrovertible evidence of a transvalvular gradient (Panels E and J), but are influenced by the potential for cardiodepression and vasodilation caused by deep general anesthesia, especially in the presence of CAVS. CAVS calcific aortic stenosis; AV Regurg. aortic valve regurgitation; Sep. Dist. separation distance; MRI magnetic resonance imaging.