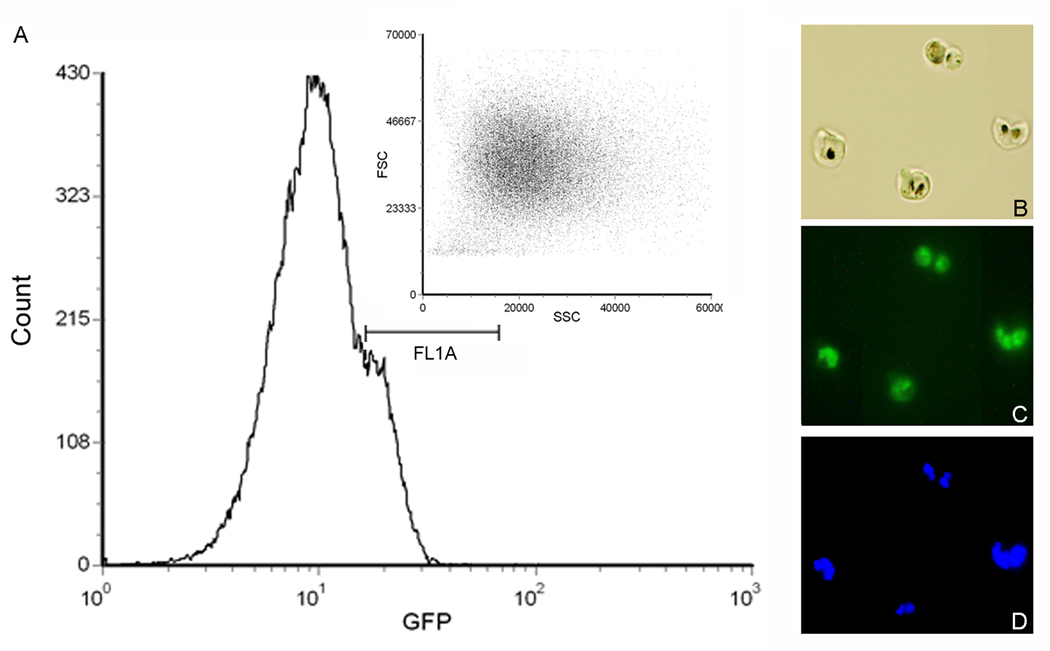
Figure 2.
Flow sorting of GFP-expressing cells. (A) Pre-sorting of GFP-positive cells by using a GFP filter and setting the gate on the GFP fluorescence intensity. In this case, the gate FL1A is used and cells with lower fluorescence intensity (unparasitized RBCs, parasites without GFP expression, etc.) are excluded from sorting. The inset shows the FSC and SSC scattergram of the selected parasitized RBCs, which is used for selection of singly-infected RBCs. (B–D) Gating for fluorescence intensity results in a parasite population made exclusively of GFP-expressing cells. (B) Light microscopic image of sorted parasitized RBCs by gating GFP fluorescence. (C) Fluorescent microscopic image of the same cells showing GFP fluorescence. (D) Fluorescent microscopic image of the same cells showing parasite nuclei stained with a fluorescent DNA dye, Hoechst-33258.

