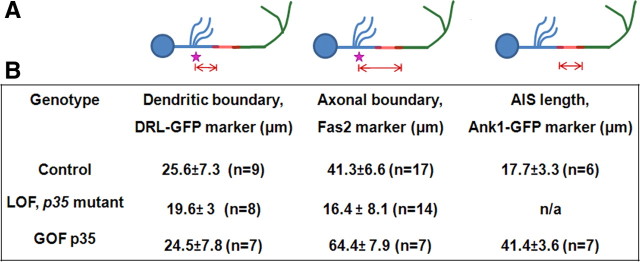
Figure 2.
Distribution patterns of polarity markers in γ-neurons at late third larval stage. A, Schematic drawing of γ-neuron shows position of related compartment analyzed in the table below. Blue represents somatodendritic; red, AIS; and green, axonal compartments; pink star, zero reference point. B, Estimation of compartment border position (mean ± SD) (for details, see Materials and Methods).

