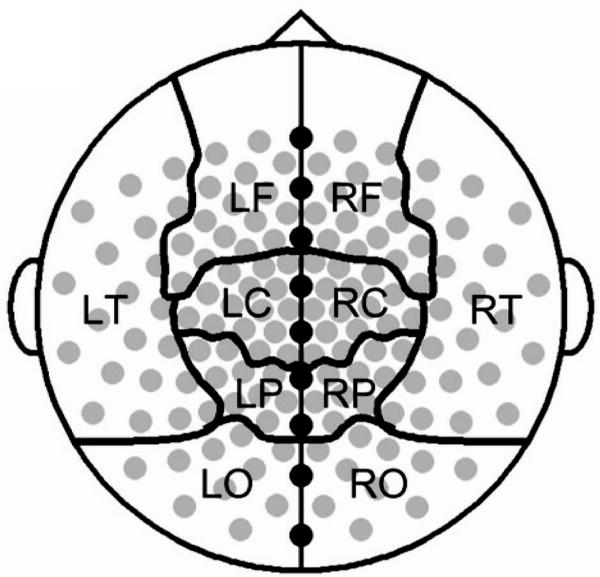
Figure 1.
The sensor montage and regional groupings. Gray circles represent sensors used in the analysis of resting MEG by cortical sector, black circles denote midline sensors excluded from regional analyses, and black lines denote the boundaries of cortical regions in the sensor level analysis. Letters indicate cortical regions: L = left, R = right, F = frontal, C = central, T = temporal, P = parietal, O = occipital.

