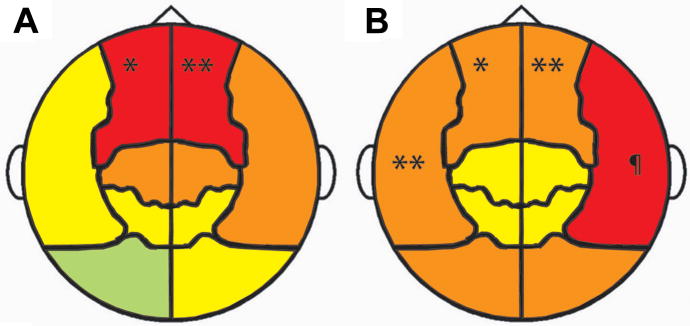
Figure 3.
A) Shift of peak oscillatory frequency in very preterm children, relative to full-term controls, in each cortical region. The magnitude of frequency shifts are denoted by colour (red -1 to -2 Hz; orange -0.5 to -1 Hz; yellow 0 to -0.5 Hz; green 0 to +0.5 Hz) and statistically significant group differences are labled (* p < 0.05; ** p < 0.005). B) Reduction of alpha (8 – 14 Hz) power in children born very preterm, relative to full-term controls, in each cortical region. Colours represent the magnitude of group differences (red -50 to -75 femptotesla (fT); orange -25 to -50 fT; yellow 0 to -25 fT) and statistically significant differences are indicated (* p < 0.05; ** p < 0.02; ¶ p < 0.003).

