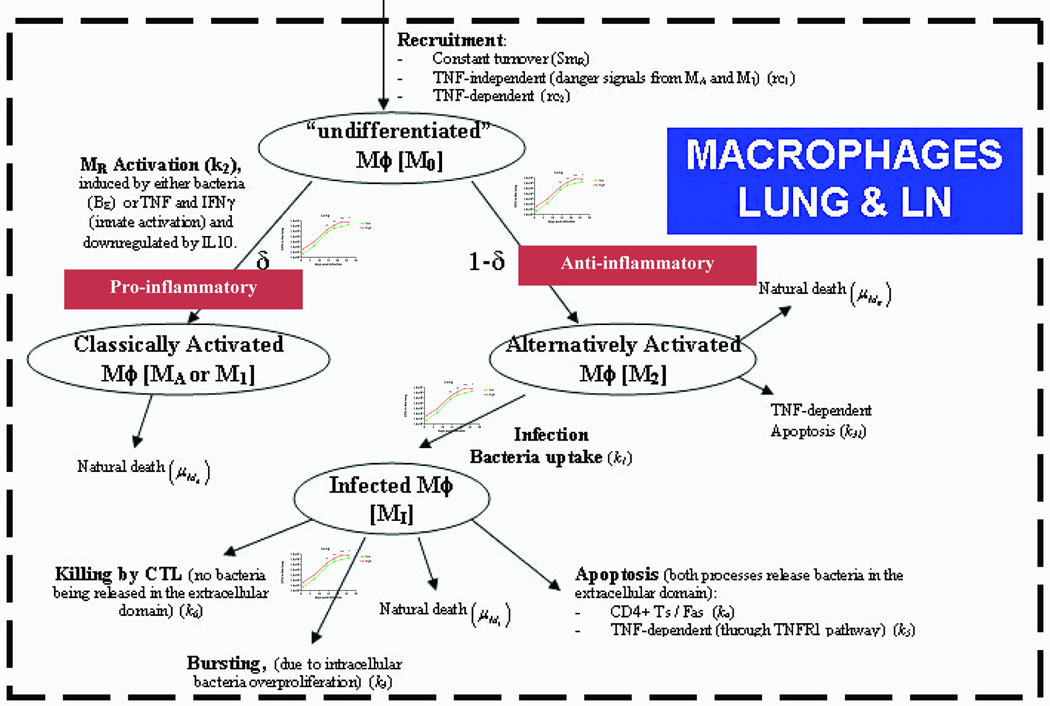
Figure 1.
Diagram of macrophage dynamics in the lung and lymph node that are represented in the model. The parameters in parenthesis represent how each mechanism is described in the model equations. CFU input/forcing functions are represented by the graphs (see Figure S1 for details on these graphs) on the branches describing M0 differentiation to CAM (or as referred in the literature as M1), AAM infection, and MI bursting.

