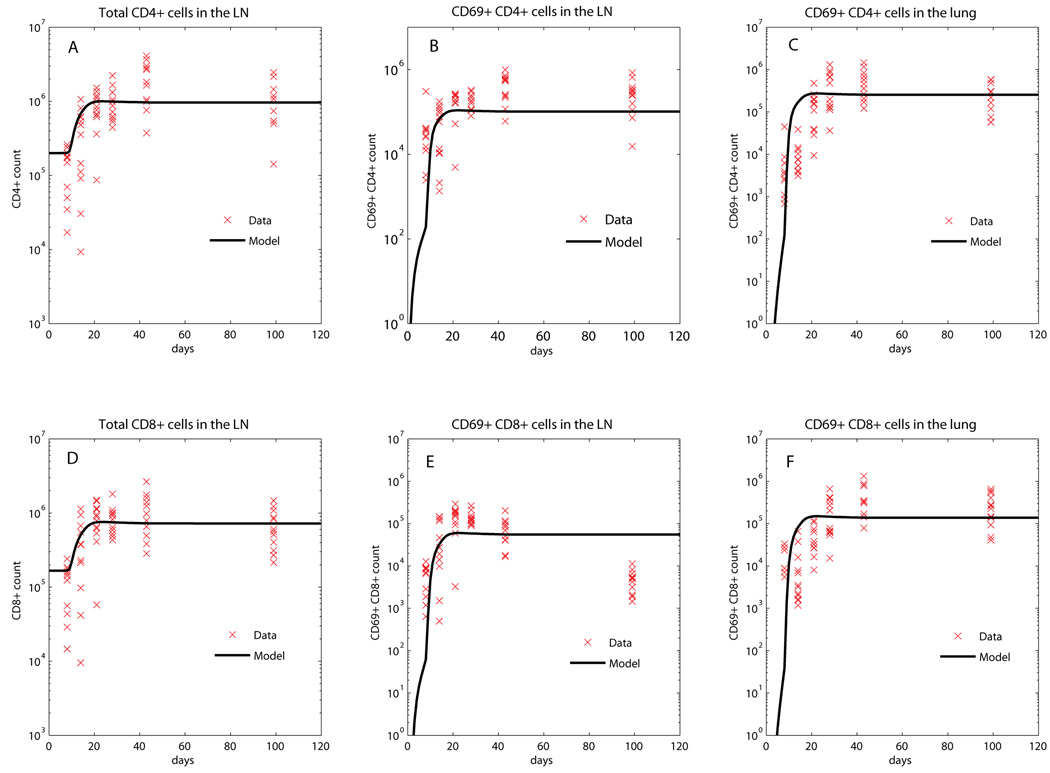
Figure 3.
Fitting of the model (CD4+ and CD8+ T cell populations) to the data. The black curves represent the best fit of our mathematical model to the data, while all the data are shown by red x. Panel A: total number of CD4+ T cells in the LN (Naïve CD4 [N4]+ Precursor Th1 ). Panel B: number of CD69+/CD4+ T cells in the LN (. Panel C: number of CD69+/CD4+T cells in the Lung (Precursor Th1 [T̂1] +Th1 [ T1 ]). Panel D: total number of CD8+T cells in the LN (Naïve CD8 [N8]+Precursor effector CD8 producing CD8 ). Panel E: number of CD69+/CD8+ T cells in the LN (Precursor effector CD8 producing CD8 . Panel F: number of CD69+/CD8+ T cells in the Lung (Precursor effector CD8 [ T80 ]+IFN-γ producing CD8 [ T8 ]+CTL [ TC ]).

