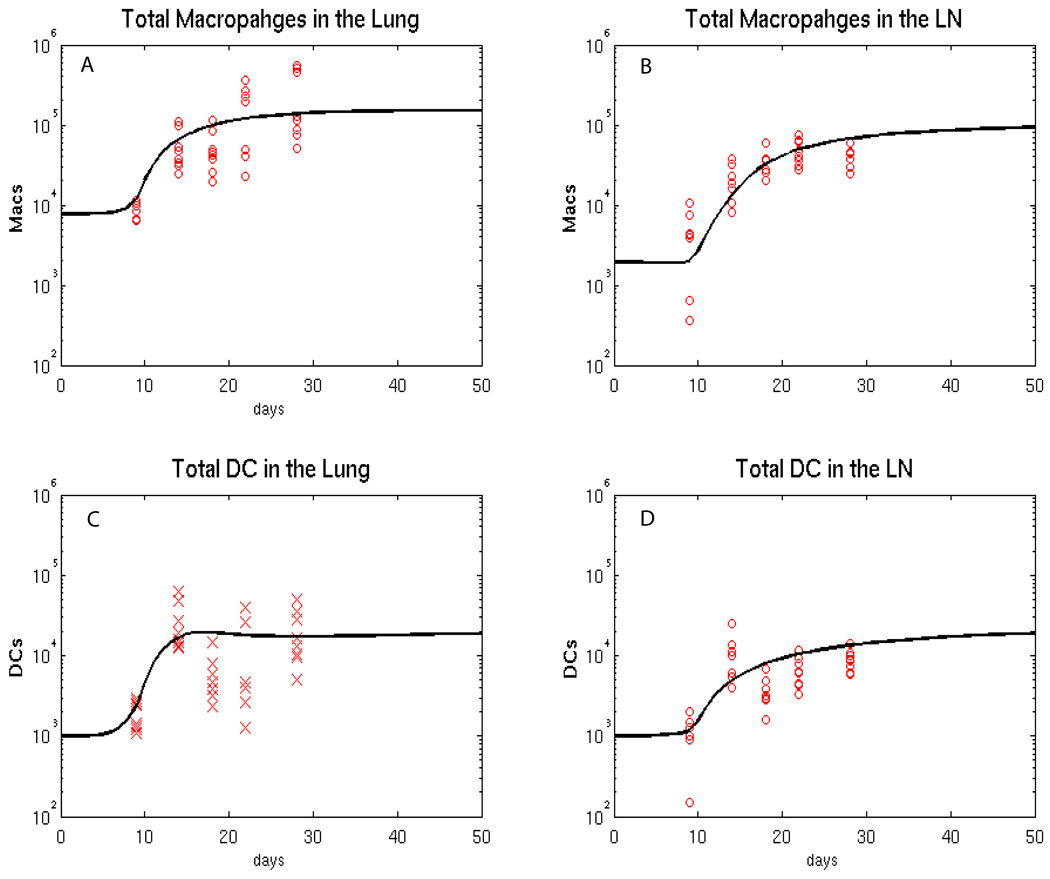
Figure 4.
Fitting of the model (macrophage and dendritic cell populations) to the data. The black curves represent the best fit of our mathematical model to the data, while all the data are shown by red x. We equally split CD11b+c+ and CD11b+c- cell data between Macs and DCs. We tried other alternative Mac/DC proportions (data not shown) where we first assigned 30% of CD11b+c+ to DC and 70% of CD11b+c+ to macrophages and then viceversa. The major impact is on DC data and the fitting was adjusted to match the new data. The major parameter changes were on DC recruitment parameters (lower rc3 and rc4, to match the lower DC data) and higher priming parameters (k14 and k17, to increase the resulting lower levels of primed T cells in the LN). Panel A: estimated total number of macrophages in the Lung. Panel B: estimated total number of macrophages in the LN. Panel C: estimated total number of DCs in the lung. Panel D: estimated total number of DCs in the LN.

