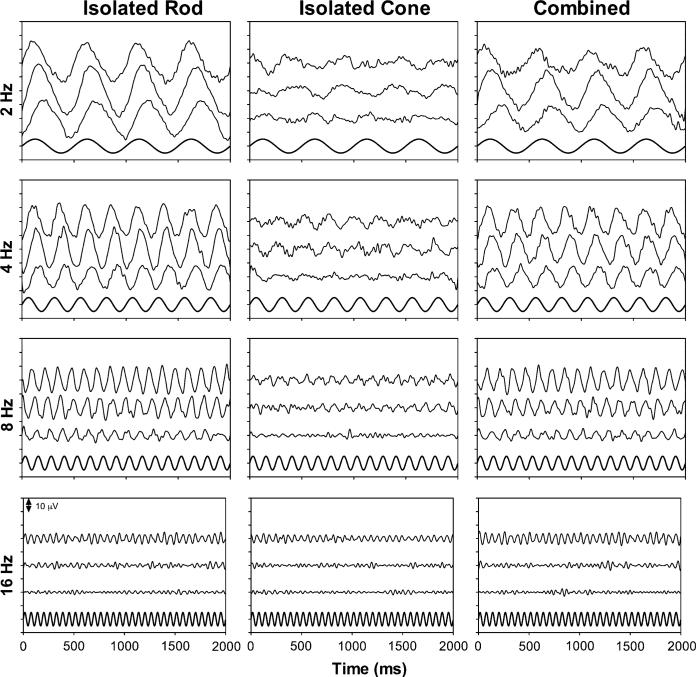
Fig. 1.
The averaged ERG waveforms for one normal observer (YS) with the isolated rod stimuli (left column), isolated cone stimuli (middle column), or the combined stimuli (right column). The high-frequency components (>30 Hz) in each waveform were removed. Each panel shows the ERG waveforms with one stimulus type and one frequency at all three light levels (top trace for 1.26 cd/m2, middle trace for 0.16 cd/m2, and the bottom trace for 0.02 cd/m2), with one unit in the y-axis for 10 μV. The sinusoidal stimulus is plotted in the bottom of each panel for reference purpose

