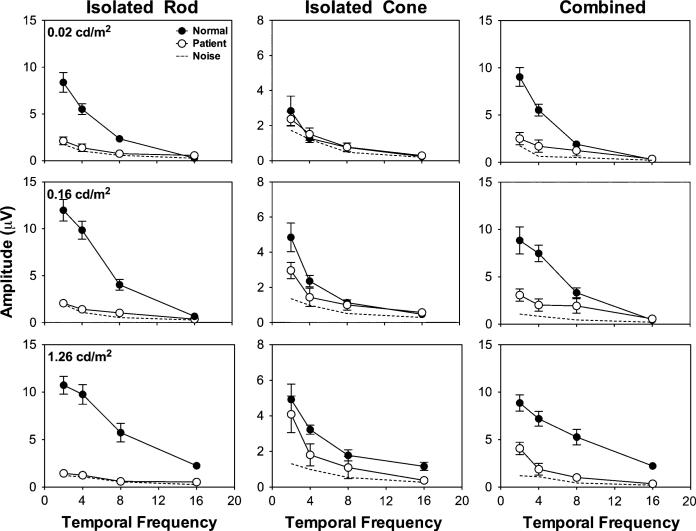
Fig. 3.
The averaged ERG amplitudes from all of the normal observers and the patients. The dashed lines are the averaged noise amplitudes from both the normal observers and patients. Note that the amplitudes for the isolated cone stimuli have different scales from those for the isolated rod or combined stimuli

