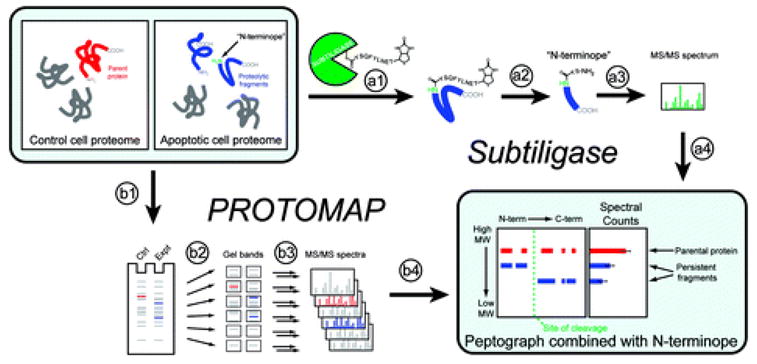
Figure 1.

Overview of Subtiligase and PROTOMAP methods. Comparison of healthy and apoptotic cell proteomes was accomplished using two complementary techniques. The Subtiligase method utilizes an engineered enzyme (a1) “subtiligase” that covalently reacts with a custom biotinylated peptide ester containing a TEV protease cleavage site. Subtiligase then selectively transfers this biotinylated peptide to free amines on the N-termini of proteins. (a2) Proteins are digested with trypsin, and “N-terminopes”, peptides corresponding to the N-termini of proteins, are purified with avidin affinity chromatography and elution with TEV protease. N-Terminopes are then (a3) sequenced using LC-MS/MS, and internally located N-terminopes that are found in apoptotic but not control proteomes are considered to be direct evidence of proteolytic cleavage and can be (a4) combined with the topographical information provided by PROTOMAP data. The PROTOMAP approach begins with (b1) separation of control and apoptotic proteins in distinct lanes of a 1D SDS–PAGE gel. (b2) Each lane is then sliced into evenly sized bands and (b3) proteins in each band are in-gel digested with trypsin and sequenced via LC-MS/MS. The resulting (b4) peptides are bioinformatically integrated into a “peptograph”, which plots peptides from control and apoptotic samples in red and blue, respectively, according to their position in the primary sequence of each protein from left to right (N- to C-terminus) and their position in the gel, from top to bottom (high to low molecular weight), thereby revealing changes in gel migration and topography such as would be expected upon proteolysis. The combination of peptographs with N-terminopes provides a near-complete description of each proteolytic event.
