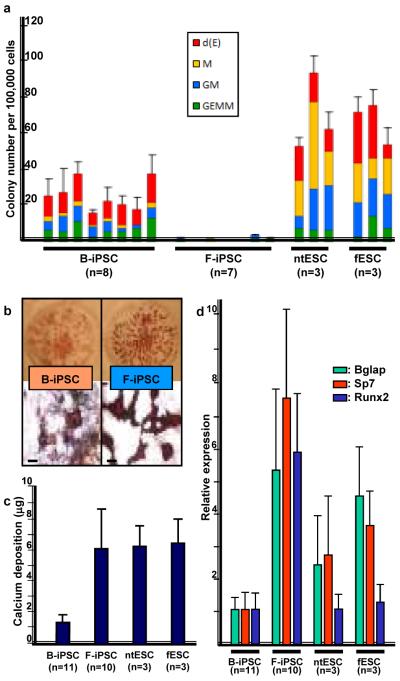
Figure 2. Differentiation of cell lines.
a, Hematopoietic colony number per 100,000 EB cells differentiated from indicated cell lines. b, Alizarin Red staining of osteogenic cultures of B-iPSC (left) and F-iPSC (right). Top: 3 cm culture dish; Bottom: stained colonies; scale bar, 500 μm. c, Quantification of elemental calcium by inductively coupled plasma – atomic emission spectroscopy49 in 5×10⁵ cells after osteogenic differentiation of indicated cell lines. d, Q-PCR of osteogenic genes, Bglap, Sp7, and Runx2 in indicated cell lines after osteogenic differentiation. Gene expression was normalized to Actin. n=number of independent clones tested. Error bars=s.d.

