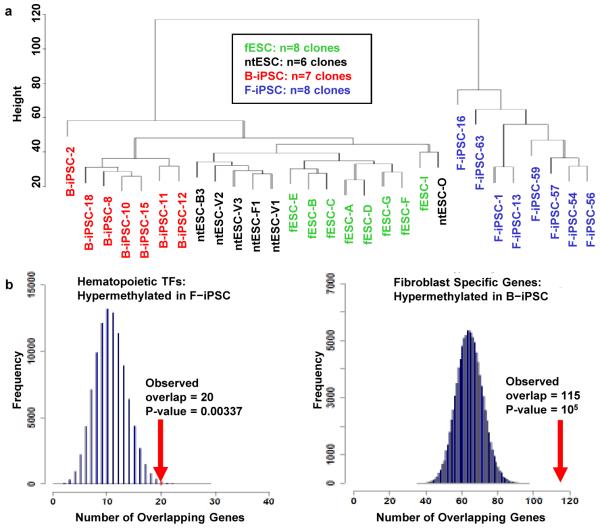
Figure 3. Analysis of methylation in stem cell lines.
a, Cluster dendrogram using probes from DMRs that distinguish B-iPSC and F-iPSC. Cell clones are described in Supplemental Table 5. b, Enrichment of DMRs for hematopoiesis and fibroblast-related transcription factors in B-iPSC and F-iPSC, relative to chance (blue histogram; 100,000 random permutations). Left panel: 20 of 74 hematopoiesis-related transcription factors overlap DMRs hypermethylated in F-IPSC (p=0.0034); Right panel: 115 of 764 fibroblast-specific genes overlap DMRs hypermethylated in B-iPSC (p=10−5).

