Fig. 3.
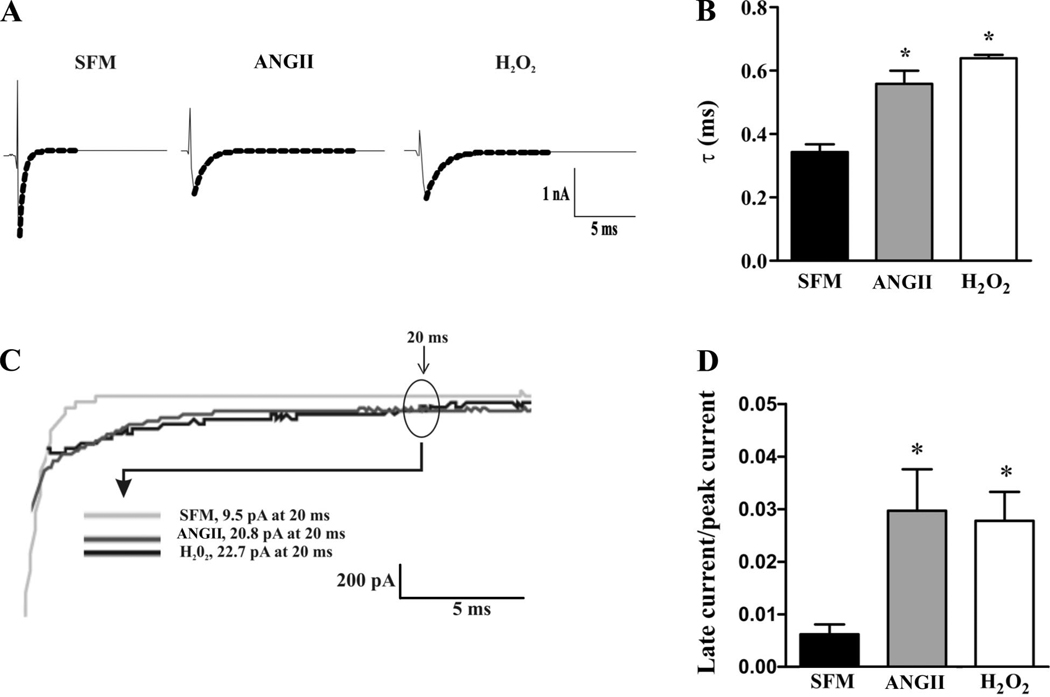
Effect of ANG II and H2O2 on Na+ channel inactivation kinetics. A: representative whole cell Na+ channel current traces from H9c2 cells treated with ANG II or H2O2 compared with control (SFM) recorded after steps to 10 mV from a holding potential of −80 mV. Macroscopic inactivation current was fitted to a single exponential decay (dotted lines). B: comparison of average time constants (τ) under the three conditions were significantly slower in the ANG II- or H2O2-treated groups than in control cells. C: comparison of representative examples of the persistent current present at 20 ms after a voltage step from −80 mV to 10 mV in control or treated cells. D: comparison of the average late currents as a function of treatment. *P < 0.05.

