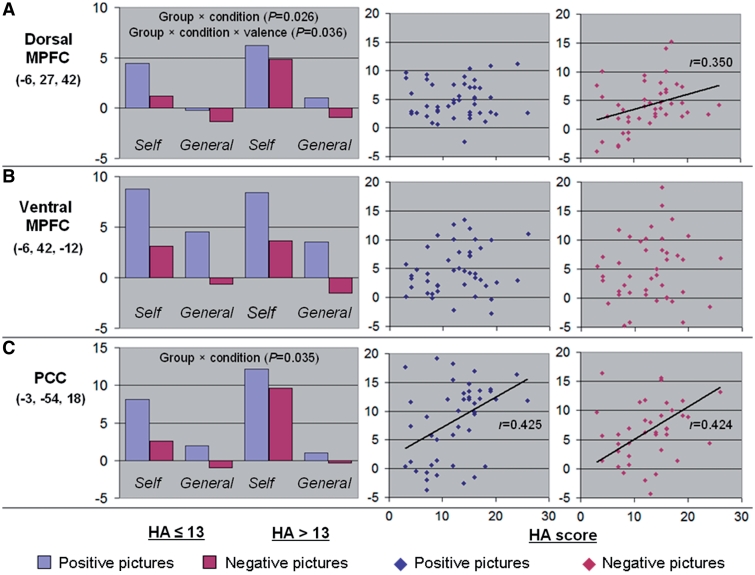
Fig. 3.
Activation of the CMS (A: dorsal MPFC; B: ventral MPFC; C: PCC) according to HA score, condition, and valence. For each ROI, the left-hand panel displays the mean beta value in self (vs control) condition and general (vs control) condition according to valence (blue: positive; red: negative) and group (HA ≤ 13 vs HA > 13). For each ROI, the right-hand panels display the correlation between the HA scores (X-axis) and the individual beta values (Y-axis) in self vs general condition for positive (blue) and negative (red) pictures. Linear adjustment curves are displayed for significant correlations.

