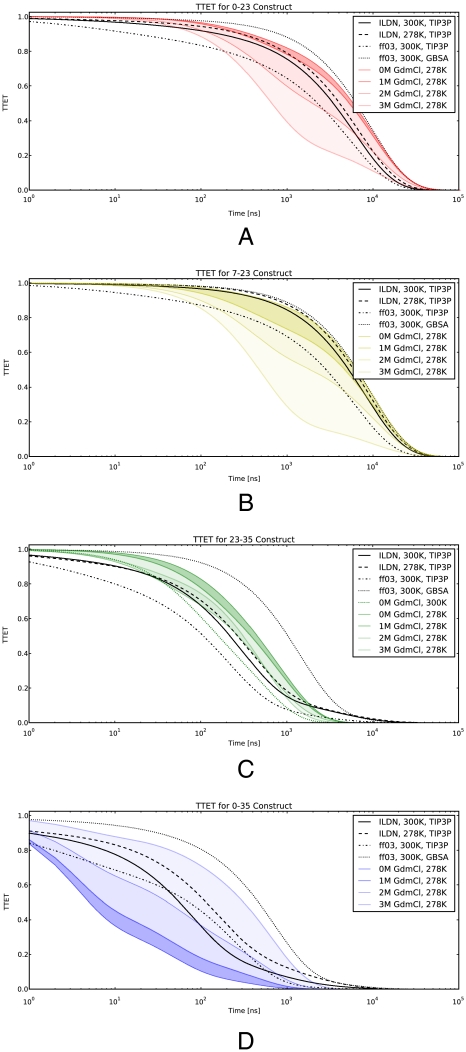
Fig. 2.
Comparing simulated TTET to experiment. Simulated TTET traces are compared to experiments. The experimental data are calculated using the exponential fits in ref. 12. GdmCl concentrations are shown as color gradients, with the darkest representing 0 M. Simulated TTET is shown for all four datasets. A displays the TTET between residues (0, 23). B shows (7, 23). C shows (23, 35). D shows (0, 35). C also contains experimental data at (0 M GdmCl, 300 K). Simulations assume 10-μs xanthone decay.

