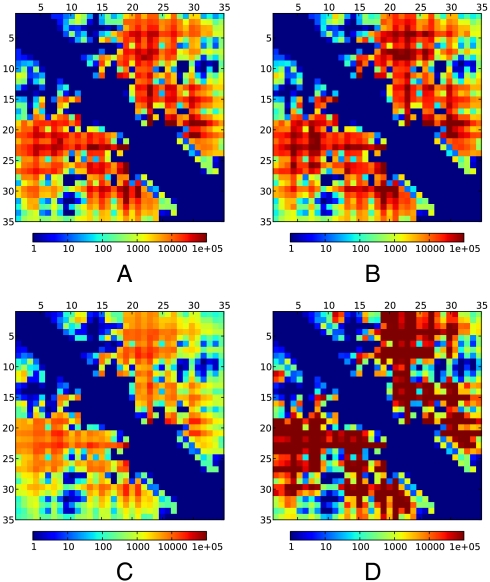
Fig. 4.
Simulated TTET for all residue pairs provide a single-residue resolution map of contact-formation timescales. The heat map shows the time required for TTET to drop to 1/e of its starting amplitude; minimum and maximum represent 1 ns and 100 μs, respectively. (A) Using the ff99SB-ILDN-TIP3P-300K dataset. (B) Using the ff99SB-ILDN-TIP3P-278K dataset. (C) Using the ff03-TIP3P-300K dataset. (D) Using the ff03-GBSA-300K dataset. No xanthone decay is assumed.

