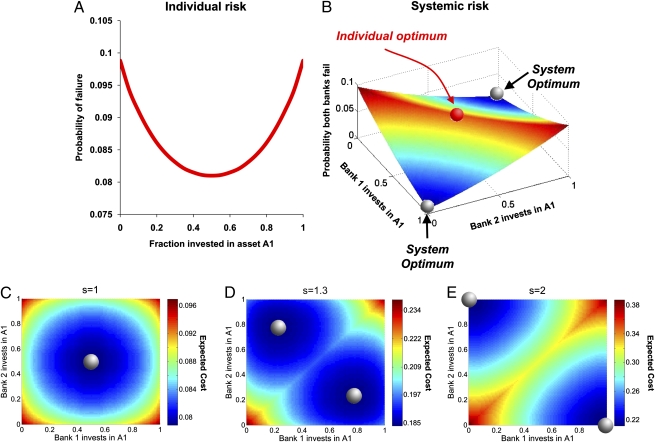
Fig. 1.
Probability of bank failure with two banks and two asset classes, A1 and A2. A fundamental tension exists between individual and system risk. Shown are the results of simulations in which the initial value of each asset is one; the loss incurred by each asset after some time t is sampled from a student t distribution with 1.5 degrees of freedom with mean = 0 and a 10% chance of being great than 1; and both banks have capital buffers such that a total loss greater than 1 causes failure. Shown is the average fraction of failures over 106 loss samplings. Each bank's individual probability of failure is minimized by investing equally in A1 and A2 (i.e., diversifying uniformly) (A). Uniform diversification, however, does not minimize systemic risk. Instead, the probability of joint failure is minimized by having one bank invest entirely in A1, whereas the other invests entirely in A2 (B). We next consider the cost function c = ks, where k is the number of failed banks, and with s moving from (C) a linear system cost of bank failure (s = 1) to (D and E) a system cost that is progressively convex (s = 1.3 in D; s = 2 in E). The lowest cost configurations are marked by a gray sphere.

