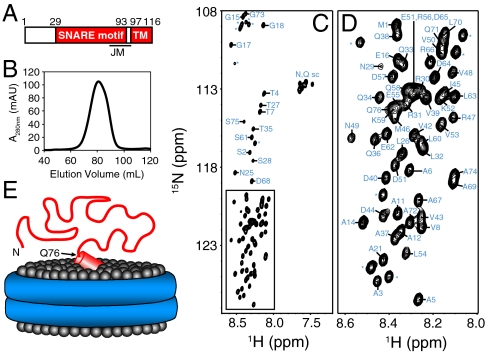
Fig. 1.
NMR analysis of synaptobrevin in nanodiscs. (A) Domain structure of synaptobrevin. Residue numbers above the bar indicate the sequence spanning the SNARE motif and the TM region. The approximate position of the juxtamembrane region (JM), which includes the C terminus of the SNARE motif and the linker joining it to the TM region, is indicated below. (B) Gel filtration on a Superdex200 column of the nanodiscs containing synaptobrevin after detergent removal and before concentrating for NMR analysis. (C, D) 1H-15N HSQC spectrum of synaptobrevin incorporated into nanodiscs. The expansion shown in D corresponds to the box of C. Cross-peak assignments are indicated (* indicates those from N-terminal residues arising from the expression vector). (E) Cartoon representing the overall structure of synaptobrevin (red) in nanodiscs with the lipid headgroups shown as gray spheres and the ApoA1 scaffold shown as a double blue ring. The diagram is meant to illustrate that residues 1–76 of synaptobrevin are highly flexible. The juxtamembrane region is represented by a tilted cylinder that represents a helix and is bound on the surface of the nanodiscs in a tilted orientation based on EPR data (25).

