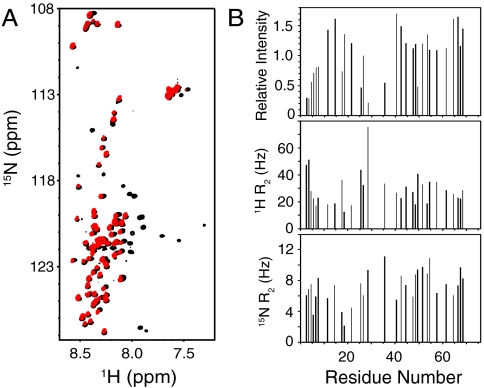
Fig. 3.
Residues 1–74 of synaptobrevin have a similar conformational behavior in solution and on liposomes. (A) Superposition of 1H-15N HSQC spectra of the soluble synaptobrevin(1–96) fragment (black contours) and full-length synaptobrevin reconstituted into liposomes composed of POPC∶DOPS 85∶15 (molar ratio) (red contours). (B) Relative cross-peak intensities (Top), and transverse relaxation rates (R2) of the 1H (Middle) and 15N (Bottom) backbone nuclei of residues 1–74 of full-length synaptobrevin in liposomes (same sample as A). The data were analyzed as in Fig. 2 C and D.

