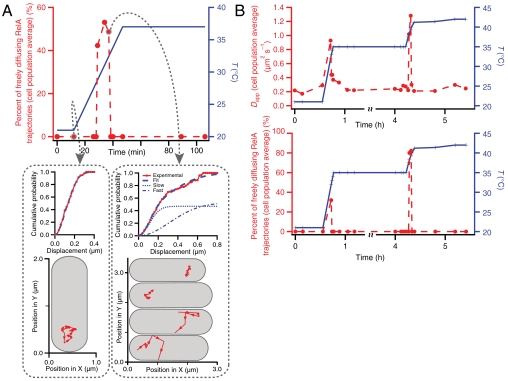
Fig. 5.
Diffusion characteristics of RelA during temperature upshift. (A) Individual RelA trajectories are recorded with a frame time of 10 ms and a laser exposure time of 2 ms. The temperature is adjusted from a constant 21 to 37 °C during the measurement. When the temperature is held constant at 21 °C, only slowly diffusing RelA trajectories are observed (see lower left panel for one representative trajectory recorded just before the start of the temperature shift). This diffusion is indistinguishable from ribosome diffusion (see Fig. 4B, green curves). During the temperature jump one transiently observes fast diffusion trajectories [see lower right panel, where two representative cells have inactive RelA (upper most cells), and the two lower cells display rapid RelA diffusion]. Very briefly roughly half of the cells display rapid RelA diffusion reminiscent of RelA diffusion during stringent response (see Fig. 4B, red curves). After the temperature has reached a constant 37 °C once again only slowly diffusing RelA trajectories are observed. Each point is an average over 20 trajectories. (B) Individual RelA trajectories are recorded with a frame time of 20 ms and a laser exposure time of 2 ms. The temperature is adjusted twice during the measurement, first from a constant 21 to 35 °C and again from 35 to 42 °C. The top panel displays apparent diffusion coefficients obtained by fitting P(r,Δt) = 1 - exp(-r2/4DappΔt) to the experimental CDFs of all the displacements in the sample plane. An apparent diffusion coefficient of 0.2 μm2 s-1 is obtained when the temperature is held constant either at 21, 35, or 42 °C. Again, rapidly diffusing RelA trajectories are observed transiently when the temperature is adjusted both from 21 to 35 °C and again from 35 to 42 °C (see lower panel). Each point is an average over 10 trajectories.

