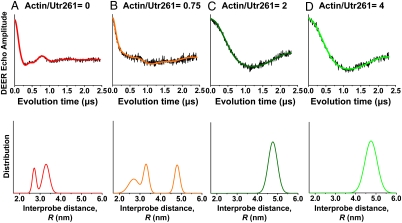
Fig. 2.
DEER waveform (Top) and distance distribution (Bottom) between the two CH domains of Utr261, as a function of the molar ratio of actin to Utr261 (spin labeled at C136 and C222). When actin is absent (A), there is a bimodal distribution of short distances that is not observed when actin is in excess (C and D), but when actin is substoichiometric (B), both populations are observed.

