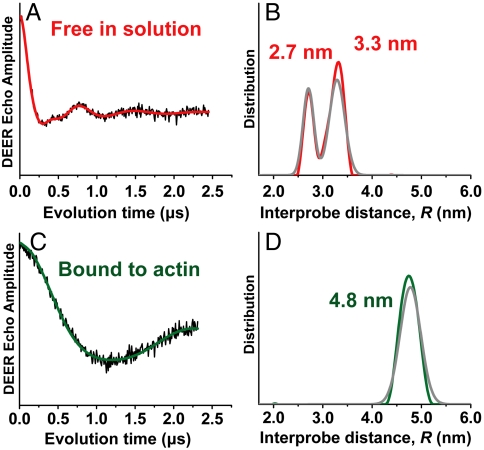
Fig. 4.
Model-independent (Tikhonov) fit to DEER waveform of Utr261, labeled at C136 and C222. (A and B) Utr261 free in solution. (C and D) Utr261 bound to actin. The distance distributions from Tikhonov fits (red and green, B and D) are also nearly identical to those from Gaussian fits (gray, from Fig. 1E). χ2 values (defining the quality of the fit) were virtually identical for Tikhonov and Gaussian fits (Fig. S3). Both methods of analysis show that the distance distribution from the actin-free sample is clearly bimodal (B), and there is no overlap of the two distance distributions in B and D. These results clearly support the induced-fit mechanism.

