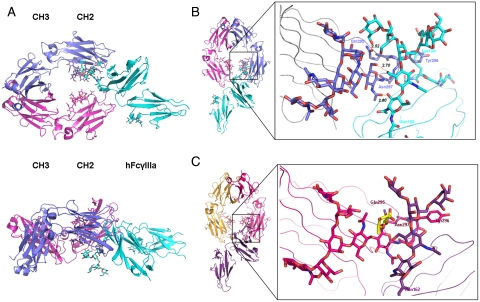
Fig. 2.
Structure of glycosylated Fc-FcγRIIIa. (A) Top and side views of the structure of the glycosylated Fc-FcγRIIIa complex. The Fc chains are shown in blue and magenta, the receptor in cyan. The oligosaccharides are depicted as ball and stick representations. (B) View on the interaction interface between afucosylated Fc fragment and glycosylated Fc receptor. Chain A of the Fc fragment is shown in blue, the Fc receptor in cyan. Hydrogen bonds are presented as dashed lines with distance between donor and acceptor shown. (C) View on the interaction interface between fucosylated Fc fragment and glycosylated Fc receptor. Chain A of the Fc fragment is shown in magenta, the Fc receptor in dark violet. Core fucose of fucosylated Fc is highlighted in yellow.

